The content of this article will benefit those of you who are starting to educate yourself about investing in the stock market and want to begin learning the link between company’s fundamentals and stock market performance.
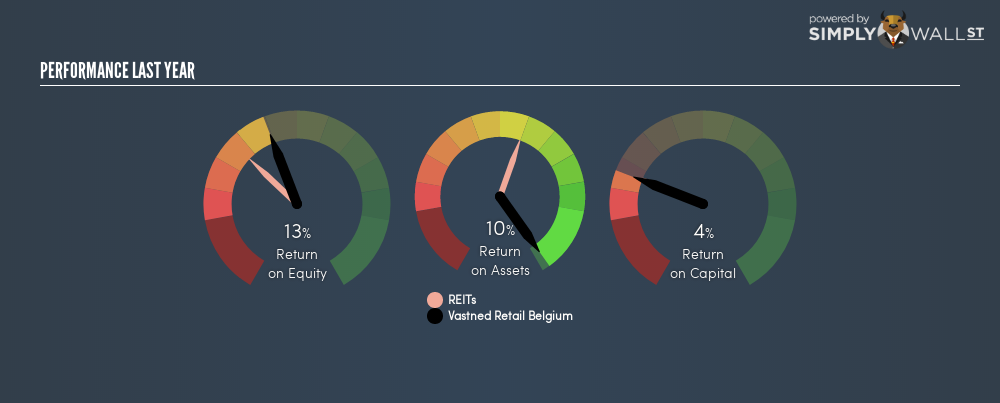
With an ROE of 12.63%, Vastned Retail Belgium SA (EBR:VASTB) outpaced its own industry which delivered a less exciting 8.55% over the past year. But what is more interesting is whether VASTB can sustain this above-average ratio. This can be measured by looking at the company’s financial leverage. With more debt, VASTB can invest even more and earn more money, thus pushing up its returns. However, ROE only measures returns against equity, not debt. This can be distorted, so let’s take a look at it further.
See our latest analysis for Vastned Retail Belgium
Breaking down ROE — the mother of all ratios
Return on Equity (ROE) is a measure of Vastned Retail Belgium’s profit relative to its shareholders’ equity. An ROE of 12.63% implies €0.13 returned on every €1 invested, so the higher the return, the better. If investors diversify their portfolio by industry, they may want to maximise their return in the Retail REITs sector by investing in the highest returning stock. But this can be misleading as each company has different costs of equity and also varying debt levels, which could artificially push up ROE whilst accumulating high interest expense.
Return on Equity = Net Profit ÷ Shareholders Equity
Returns are usually compared to costs to measure the efficiency of capital. Vastned Retail Belgium’s cost of equity is 8.19%. Given a positive discrepancy of 4.44% between return and cost, this indicates that Vastned Retail Belgium pays less for its capital than what it generates in return, which is a sign of capital efficiency. ROE can be split up into three useful ratios: net profit margin, asset turnover, and financial leverage. This is called the Dupont Formula:
Dupont Formula
ROE = profit margin × asset turnover × financial leverage
ROE = (annual net profit ÷ sales) × (sales ÷ assets) × (assets ÷ shareholders’ equity)
ROE = annual net profit ÷ shareholders’ equity
 ENXTBR:VASTB Last Perf July 30th 18
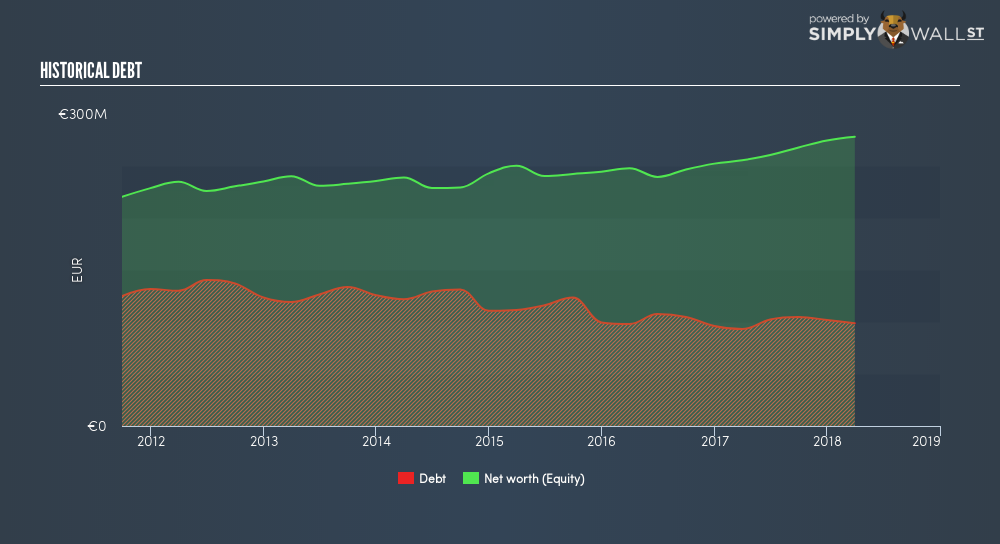
Essentially, profit margin shows how much money the company makes after paying for all its expenses. Asset turnover shows how much revenue Vastned Retail Belgium can generate with its current asset base. Finally, financial leverage will be our main focus today. It shows how much of assets are funded by equity and can show how sustainable the company’s capital structure is. ROE can be inflated by disproportionately high levels of debt. This is also unsustainable due to the high interest cost that the company will also incur. Thus, we should look at Vastned Retail Belgium’s debt-to-equity ratio to examine sustainability of its returns. The most recent ratio is 35.54%, which is sensible and indicates Vastned Retail Belgium has not taken on too much leverage. Thus, we can conclude its above-average ROE is generated from its capacity to increase profit without a large debt burden.
 ENXTBR:VASTB Historical Debt July 30th 18
Next Steps:
ROE is a simple yet informative ratio, illustrating the various components that each measure the quality of the overall stock. Vastned Retail Belgium exhibits a strong ROE against its peers, as well as sufficient returns to cover its cost of equity. ROE is not likely to be inflated by excessive debt funding, giving shareholders more conviction in the sustainability of high returns. ROE is a helpful signal, but it is definitely not sufficient on its own to make an investment decision.
For Vastned Retail Belgium, I’ve put together three fundamental factors you should further examine:
- Financial Health: Does it have a healthy balance sheet? Take a look at our free balance sheet analysis with six simple checks on key factors like leverage and risk.
- Valuation: What is Vastned Retail Belgium worth today? Is the stock undervalued, even when its growth outlook is factored into its intrinsic value? The intrinsic value infographic in our free research report helps visualize whether Vastned Retail Belgium is currently mispriced by the market.
- Other High-Growth Alternatives : Are there other high-growth stocks you could be holding instead of Vastned Retail Belgium? Explore our interactive list of stocks with large growth potential to get an idea of what else is out there you may be missing!
To help readers see past the short term volatility of the financial market, we aim to bring you a long-term focused research analysis purely driven by fundamental data. Note that our analysis does not factor in the latest price-sensitive company announcements.
The author is an independent contributor and at the time of publication had no position in the stocks mentioned. For errors that warrant correction please contact the editor at editorial-team@simplywallst.com.
Discounted cash flow calculation for every stock
Simply Wall St does a detailed discounted cash flow calculation every 6 hours for every stock on the market, so if you want to find the intrinsic value of any company just search here. It’s FREE.